eCommerce dashboards provide real-time insight into the dynamics of online stores and allow you to quickly identify areas that require urgent action, streamlining workflows, and re-allocating resources. A well-tailored data visualization software is a valuable marketing tool. What are the best tips to personalize a dashboard? Here are a few tricks.
As online stores gain more access to data, the need to find simple ways to visualize it to make it understandable and actionable grows. Data visualization software directly accomplishes this task by creating static or moving images that convey concepts in a way that words and numbers alone cannot. Top eCommerce professionals use dashboards to quickly see the most important aspects of their data to efficiently make better informed strategic decisions. Analysts at research and advisory firm Gartner predict that by 2025, data stories (explaining raw data with visualizations) will be the most common way to use analytics, with 75% of data stories automatically generated using augmented intelligence and machine learning rather than generated by data analysts.
What are the benefits of data visualization? AiMultiple lists some of them:
- faster problem solving through better access to business information,
- identifying dependencies and patterns,
- identifying and tracking emerging trends,
- easiness of communication between parties involved in the process,
- better understanding of operational and business activities,
- direct interaction with data.
Data visualization tools
Because of the growing demand for data analytics skills, analytics software companies stepped out to meet users’ needs and began creating plug-ins and extensions to make data more actionable. Here are some popular solutions:
Google Data Studio
Google Data Studio includes interactive dashboards and automated reporting. This cloud-based platform imports data from multiple sources, including Google Analytics, Google Ads and spreadsheets, and integrates with more than 150 other cloud, SQL and eCommerce platforms. Google Data Studio supports a wide range of data visualizations, including time series, bar charts, pie charts, tables, heat maps, geographic maps, scorecards, scatter plots, dot plots, and area charts.
Dedicated Software
Tools like Tableau or Infogram are online platforms where anyone can create a data visualization. Data can be imported from a spreadsheet or input manually. According to the manufacturers, one can create almost any type of visualization using their platform. It is a comprehensive online data visualization builder. The tools offer diverse and powerful options.
Built-in Dashboards
It is not uncommon to talk about dashboards when it comes to the topic of data visualization. The key difference between the two terms is the frequency of data updates. Visualizations are generated from data, while dashboards are updated more regularly to show changes within a data set.
Many vendors of business support software, such as SALESmanago, integrate dashboards into their tools to provide accurate real-time visualization of data.
Dashboards for eCommerce
In order for a dashboard to fulfill its purpose, it should be adjusted to the needs of the specialist who uses it. Excessive, inadequate, redundant data – it all blurs the picture and makes the dashboard non-functional. That is why it is so important to properly adjust the dashboard to the specifics of your business. This idea guided our specialists, who prepared ready-made dashboard templates.
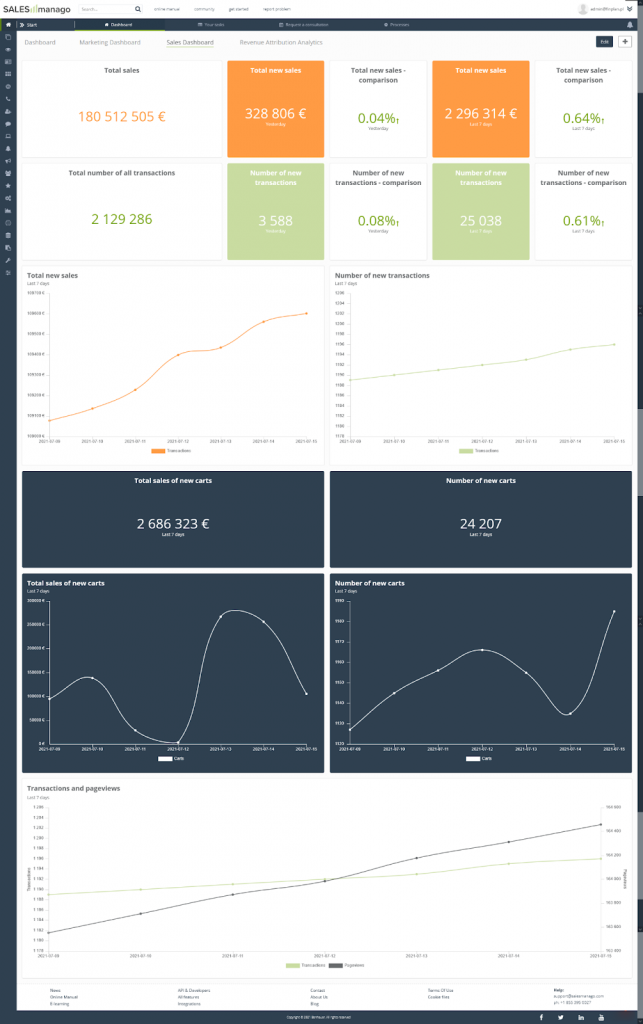
From the eCommerce point of view, one of the most important processes to track is sales. Among SALESmanago Dashboard templates you will find a composition dedicated to tracking sales results. The composition of this Dashboard consists of:
- total sales,
- total new sales – figures (previous day and last 7 days),
- total new sales – chart for last 7 days,
- total new sales – comparison (previous day and last 7 days),
- total number of all transactions,
- number of new transactions – figure (previous day and last 7 days),
- number of new deals – chart for last 7 days,
- number of new transactions – comparison (previous day and last 7 days),
- total new carts – figures and chart for last 7 days,
- number of new carts – figures and chart for last 7 days,
- transactions combined with page views.
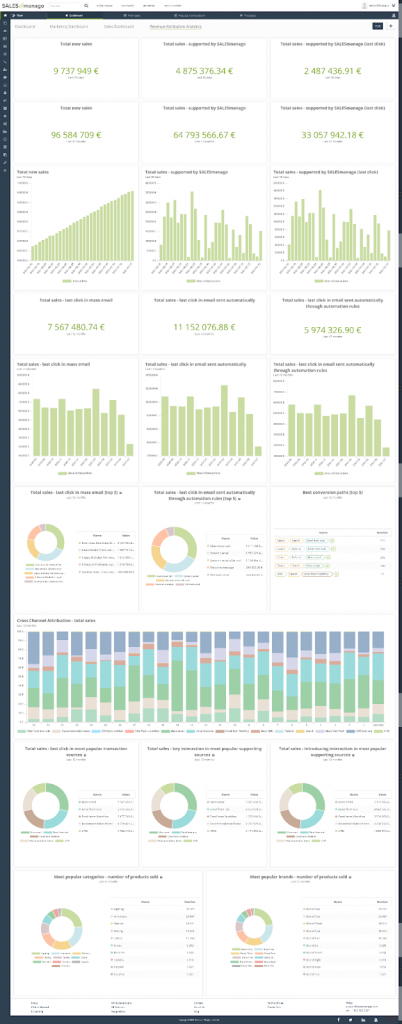
For many people, such statistics are sufficient. However, it is worth knowing that you can easily go much deeper into the analytics of online store statistics. For this, you can use the Revenue Attribution Analytics Dashboard template. It consists of:
- information about the total sales, including sales supported by SALESmanago, (30 days and 12 months),
- information about sales supported by mass, automatic and sent-from-rules messages,
- summaries of best-performing messages and conversion paths,
- information about Cross Channel Attribution sales,
- information on the best sources of last click and supporting transactions,
- information on top categories and products.
A detailed description of each component can be found here:
Revenue Attribution Analytics and Product Analytics
The templates themselves are quite versatile and as presented will be useful for most eCommerce stores. However, you can customize them even better to suit your needs. Here are 7 clever tricks that will turn generic templates into personalized assistants for any specialist.
7 quick ideas for personalizing eCommerce dashboards
The full dashboard from the Revenue Attribution template may be too elaborate for some online store configurations. Fortunately, by using ready-made Widgets, you can customize the view that interests you in no time.
Case #1 You have a small eCommerce
What’s worth tracking when you have a small eCommerce site? You may want to trim down your template a bit in the beginning so you can focus on building revenue. Therefore, if you’re just starting out, stick with just sales data. Additional analysis of Cross Channel Attribution and top selling brands can bring more mess than clarification.
Of course, you constantly have access to this data, so once you feel confident with your current Dashboard template, you can slowly start adding more variables.
Case #2 You have few products in your store
If your offerings are robust but not very diverse, you don’t necessarily need to focus on which products sell best. It may be much more important to optimize your conversion paths.
Keeping track of your conversion paths widget, but also check:
- The average sales value – last click,
- The average number of products per transaction – last click,
- Cross Channel attribution,
- Introducing and Key interactions.
Optimizing purchase paths will help you maximize profits even with a leaner portfolio.
Case #3 Your business is based on Dropshipping
Dropshipping is a retail fulfillment method in which a store does not keep the products it sells in stock. Instead, when a store sells a product in the dropshipping model, it buys it from a third party and ships it directly to the customer.
In such a business model, statistics showing the most popular categories and products are especially important. This helps to properly plan further cooperation and negotiate preferential conditions.
Case #4 You have products from different brands
Popular marketplaces nowadays often offer various brands. If your store belongs to this category, we recommend adding widgets dedicated to the most popular manufacturers and brands. Transparent data summary helps to plan promotion and allocation of partners’ advertising budgets accordingly.
Case #5 You use multiple recommendation mechanisms
The mechanism of recommendations perfectly supports sales in eCommerce. It allows you to suggest interesting products to customers in different channels. If you use this mechanism in your eCommerce, you can easily track which specific frames and channels work best for your audience. You can use widgets analyzing cross-channel attribution, sales in different channels, and in particular the number of transactions and total sales after clicking the recommendation frames.
Case #6 You have a large eCommerce with advanced implementations
The larger you have a store, the more processes contribute to its smooth functioning. In eCommerce with advanced implementations, it is worth highlighting on the dashboard analytics for workflow processes and rules. Ready-made widgets allow you to check which actions (automatic message, Web Push notification, text message) in the processes work best in terms of generating sales.
Case #7 You have plans to grow your store
In the lifecycle of any store, there comes a time for more expansive activities, such as expanding your portfolio. A dashboard adapted to product analytics can greatly facilitate strategic business decisions. Knowledge about the best-selling products of the most popular categories, manufacturers and brands allows you to better plan a new offer and undertake profitable cooperation. Additionally, it is also worth looking at the performance of individual communication channels in order to prepare effective advertising campaigns.
Benefits of using SALESmanago Dashboards
As already mentioned, you have several options for visualizing analytics data in your store. It is quite popular to use Google Tag Manager for this purpose. However, in eCommerce using SALESmanago you should consider verifying data also in built-in dashboards. Naturally, they will present slightly different data – SALESmanago is based on a different attribution model in the case of supported sales. In Google Analytics, revenue that has been generated by SALESmanago is only monitored if someone accesses the site through a link (clicking on the link) with the utm_source=salesmanago parameter added. These differences are especially noticeable with the free version of Google Analytics.
What’s more, when using SALESmanago’s built-in dashboards, there is less risk of incorrectly linking events in the store. Most actions are monitored automatically and the implementation is code-free. The technical support of the project manager, who helps to properly configure the system, is also important. There is no need to hire an agency or a specialist-freelancer for this.
SALESmanago business dashboards – wrap up
One of the most important MarTech trends is to make software as user-friendly as possible. For this purpose, developers create a variety of no-code features. What’s more, they try to make it as easy as possible to use data in everyday life – whether in the form of an elegant visualization or smart, personalized hints on how to use their software.
It’s worth using these facilities, especially if they are fully customizable and function as a free part of the platform you already use. If you feel like trying out a personalized SALESmanago Business Dashboard, create one by choosing a mix of the most important KPIs in your eCommerce, or ask your success manager for advice.
 Follow