2019 was one of the most successful in the history of SALESmanago. The company joined the exclusive club of SaaS companies with 10 mln subscription ARR (only 5% of SaaS Companies achieve that level). This happened as a very intensive 3 year work on all KPIs and metrics starting from average value of new customer, CAC, retention rate, NPS and many others. Let’s see how we managed fast growth with 100% organic (no external money) approach.
Introduction
In 2016 SALESmanago consumed 6 mln Euro financing round from leading European VC and achieved nearly 100% revenue growth the same year. Everybody was extremely thrilled but lack of proper understanding of the business metrics and customers threw the company into difficult times and a period of slower growth in 2017 with very weak metrics. The article shows how, during the last 3 years, by intensive work with data and advice from experienced people we have managed to bring the company back on a fast growth track with impressive metrics.
Making Core Revenues a Core of SaaS business
Simple P&L account does not work in SaaS and measuring this type of business requires taking a very specific approach. Focusing on Subscription Revenues is a starting point and it’s definitely much easier in International Financial Reporting Standards. So if you run your SaaS company, forget about calculating your business metrics with some revenues from custom IT development, customer ad budgets or barter revenues. This will destroy and completely blur all of typical SaaS metrics like CAC, ARPU or Churn Rate Calculation.
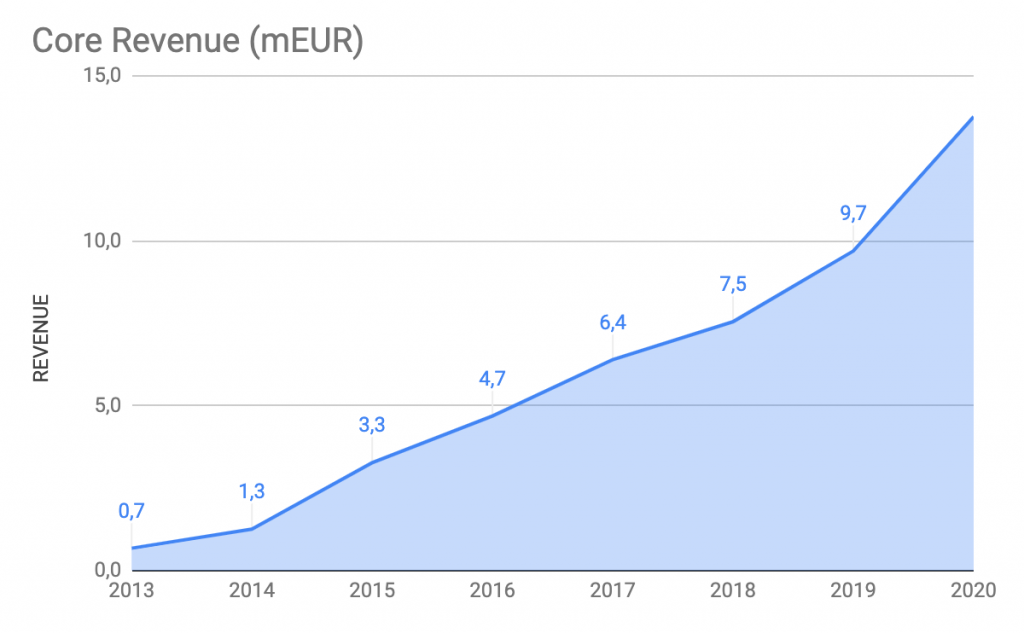
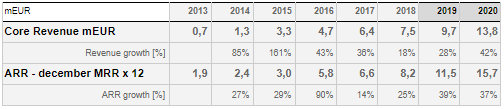
If you understand this now, it’s time to understand that in SaaS only future counts. So if you can calculate your total core revenues for the past year, be ready to talk with your potential investors only about your ARR – Annual Run Rate or cARR – Contracted Annual Revenue which means current month MRR – Monthly Recurring Revenue multiplied by 12. Let’s have a look at SALESmanago Core Revenues and cARR in the last year’s growth as well as 2020 plan.
Rule of 40 – understanding growth & profitability
Focusing only on the growth and revenue side is not a perfect way to look at SaaS companies. It is quite normal that they acquire huge cash investments which let them grow faster than it would be possible only by bootstrapping (using solely earned money for fueling growth). In that case, we see a lot of companies without any profitability and quite impressive revenue growth. How to balance investment, growth and profitability and how to compare different SaaS companies? To be able to do that and measure they market value, professional researchers uses “Rule of 40” as a metric which combines two important factors – revenue growth and profitability (EBITDA margin):
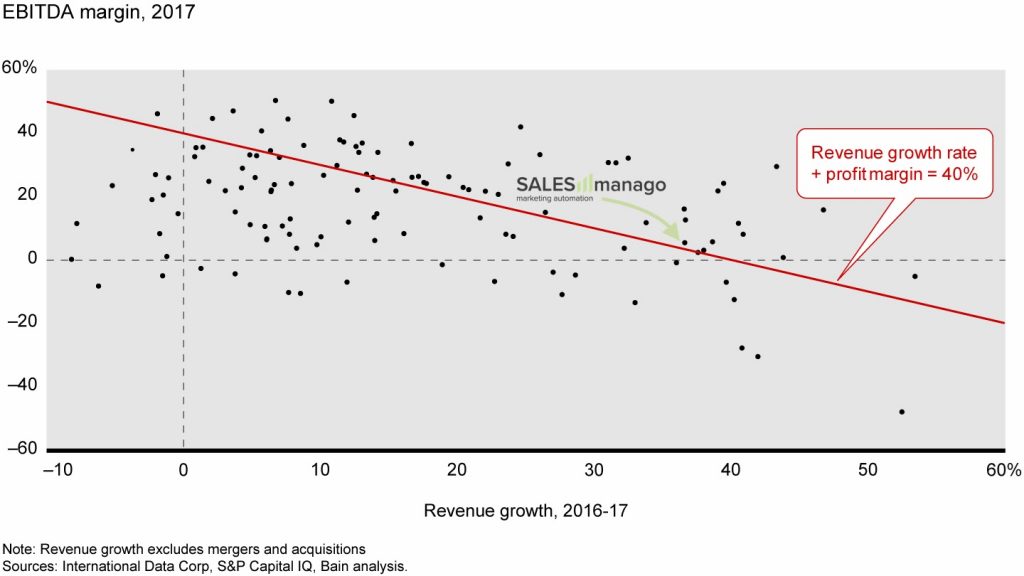
If you combine those two factors, you can easily find those companies who have a proper ratio of growth vs profitability, which should be exactly at 40 or very close.
SaaS companies that reach a certain maturity level, which is placed at 10m ARR and keeps a proper balance between growth and EBITDA are recognized as well-proven and having a strong base for further dynamic growth.
Hype Factor will tell you if you are a real business or just a HYPE
Very few SaaS companies have not taken the advantage of external financing. Measuring capital efficiency is crucial to understand how prospective the company is. Hype is nice but it cannot really dominate the real business factors in the context of raising the capital from business angels, private equities or venture capitals. Dave Kellog introduced simple factor which helps to quantify hype, which he called Hype Factor:
Hype Factor = Capital Raised / Annual Recurring Revenue
Which have a grade scale:
- <1-2 is a target, very capital efficient company
- 2-3 is good, particularly well before an IPO
- 3-5 is not good, too much hype and too little ARR
- >5 suggests there is very little own business value at all
If you take a closer look on some companies you can find out that there are some huge discrepancies between them. In case of SALESmanago Marketing Automation we were able to keep this factor at level below 1 and let’s compare this with competitive business, Exponea (financial data taken from Owler).
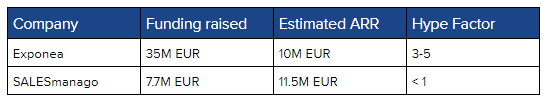
As you can see differences between those companies are quite significant, so looking only at ARR and growth is not a perfect reason for comparing them. Without looking at business KPI’s your view is blurred and may lead to wrong conclusions and decisions.
What makes SALESmanago unique is the ability to maintain its growth combined with very low external capital consumption and healthy business KPI’s.
Improvement of key Metrics in a Data Driven Company
From the very beginning of operations, SALESmanago had different packages and pricing tiers for almost every size of clients and verticals. In order to successfully scale the company and continue high growth of revenues we needed to start with definition of our Perfect Customer which would then translate into:
- Improvement of Retention Rates
- Improvement of Average MRR
- Improvement of NPS
Finding “Perfect” Customer
The aim of this exercise was to find the answers to the following questions:
- To whom say “no” in the sales process
- How to structure the license agreement
- Where is our perfect target group and what TAM (Total Available Market) is?
The first step was to understand how our current base of Customers behaves. Good way to do that is to perform cohort analysis. In our case, we have built a dataset based on the full history of our Customers from the previous 5 years. Results were calculated for the whole base and smaller groups divided by size (6 MRR segments) and verticals. We’ve checked how long our Customers lived and how their MRR was changing in months. That helped us to find key takeaways:
- B2B Customers MRR grows very slowly in time, have lower utilization of our software modules and are responsible only for 10% of total revenues,
- B2C Customers of proper size churn less, their MRR value grows dynamically in time and have significantly higher NPS rates,
- Group of bigger Customers (segments 4-6) are responsible for 70% of revenue at a quantity of 30% and have much better retention rates, higher NPS and are using SALESmanago more efficiently.
New sales approach and proper opportunities selection
SALESmanago has a very strong business development-oriented DNA. This is why it was quite difficult for us to say “no” to some groups of potential customers who wanted to sign the agreement with us. Based on all of the data exercises we had performed it was quite obvious that we need to push entry-level price higher, change the way our agreements work and optimize the sales process for acquiring bigger customers. Most important changes were:
- 3 times higher entry-level price for small & medium companies,
- only annual agreements in place of the undefined period with one-month notice ones,
- dedicated Marketing Automation Strategy team with skilled professionals focused on supporting sales processes to bigger Customers,
- set of presales and after-sales documentation to manage Customers expectations and secure proper implementation process in order to deliver the best in class time to revenue results.
Impact on customer retention and churn rates
Everyone is tracking their churn & retention rates. If not, they should start immediately! Both of them are used to understand and measure the ability of your company to keep already acquired customers in time. Those metrics are presented as a percentage of your customer or revenue base:
- Churn Rates focuses on how much your company is losing in a period of time, most often calculated monthly and annually:
- Logo Churn, simple metric showing you how many Customers in terms of quantity you are losing in each period of time.
- Revenue Churn, shown as a percentage of the total value of Customers who left versus revenue base. You can calculate it in 2 ways:
- Gross Churn = Revenue Lost/Revenue Base * 100%
- Net Churn = (Revenue Lost + Expansion-Downgrade)/Revenue Base * 100%
As you can see, net churn takes into consideration something called “expansion & downgrade” which are the increases and decreases of your Customers’ payments. In a healthy SaaS company, net churn should be better than gross, because the growth of existing Customers should cover at least some part value of lost Customers. You need to remember to always take the same periods for those calculations!
- Retention Rates focuses on how much your company is retaining in time:
- Customer Retention shows you how many % of Customers stay with you in each period of time. It is ranged from 0 to 100%.
- Revenue Retention, known also as subscription or dollar retention rate. In terms of retention you have also 2 variants:
- Net Revenue Retention, this one is quite similar to Net Churn but shows how much revenue from the previous period you were able to keep for the next one, which formula is 1+(churn+expansion-downgrade)/Revenue Base. Perfectly net revenue retention should be above 100%, then your customer base is healthy enough to give you a solid basis for 50% and higher growth.
- Gross Dollar Retention, focuses strictly on negative aspects of your revenue base changes. Shows you how much of revenue you were able to keep without looking at expansion:
1-(Churn+Downgrade)/Revenue Base
Most of the companies focus on why their Customers are churning. However, it is very important, in our opinion it is far more relevant to focus on why Customers are staying with us. Working closely with your active Customers should give knowledge about:
- most important KPI’s for their business,
- how your solution or product helps them reach their targets,
- what should change to fulfill better their needs,
- why they decided to choose your product and what makes them stay.
Proper understanding of those will help you take proper actions and change the way you work with Customers. Moreover, when you focus your customer success teams and support processes on them you can benefit from:
- Stickiness focusing effort of account managers on cooperation with customers who really can benefit from your software lets them implement processes which impact their most important KPI’s and makes them more dependent on your solution.
- Net Promoter Score (NPS) when software development and customer support go aligned with Customer’s needs, which is much easier when you precisely know where to focus, your Customers’ happiness grows and they will more likely recommend your solutions to their friends.
- Upsell when you will start to cooperate closely with your Customers you will better understand what additional features and services they need in their daily routine which you can cover. This builds additional space to upsell those and increase their monthly fee.
- Expansion – most SaaS pricings have tiers based on different types of usage. Some of them focus on seats/users, database size, sendings or data points. That’s why better support and higher utilization impacts your revenue directly. Customers become more involved, grow quicker, pay more and improve your revenue retention rates.
Recommendations, use cases and success stories – when you finally align all of the processes for your best performing segments of Customers it will be a much easier thing for you to build such white papers and recommendation systems. It is not a mystery that such proofs from your existing Customers powers up your sales and makes it easier to reach new prospects in the market.
Results of hard work and focus are very clear and visible on revenue retention metrics:
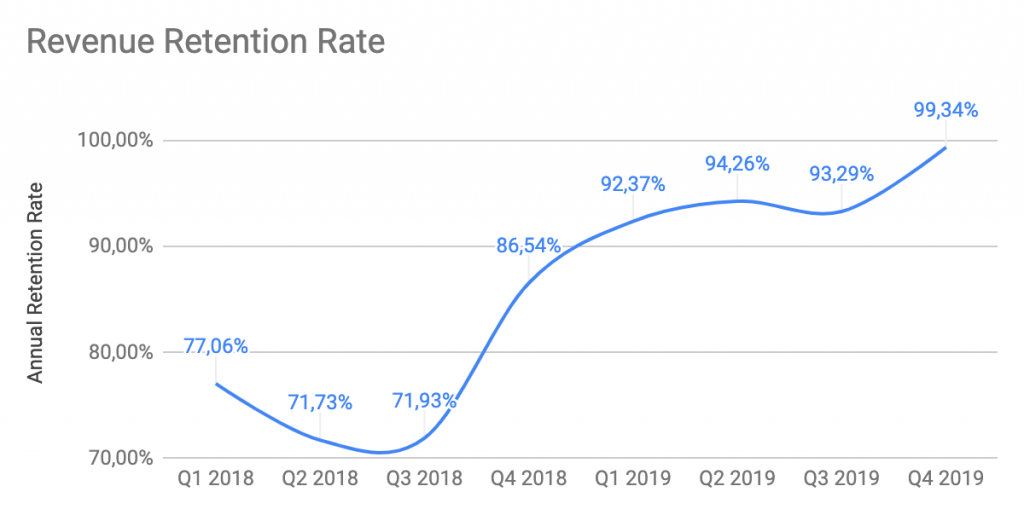
You need to know that keeping revenue retention rates near to 100% means for you that all of the new sales is a pure fuel for the growth of your company because you don’t need to cover losses caused by Customers who left.
Impact on Average Revenue Per Customer
Sales is basically the most important motor, propeller and rudder of every fast-growing SaaS company. To properly use the potential of your salesforce you need to work hard on keeping their focus and time on those prospects who you really want to acquire (fits to your perfect profile). Everything starts from leads, where you can make the first simple steps:
- SGL – Sales Generated Leads, when you want to go after bigger Customers marketing campaigns will not be enough. You need to use your sales force and make them reach prospects by themself. To do it properly you need to define who they should engage (CMO, VP of Sales, CTO). The second thing is to precisely target their work, good idea is to prepare a list of companies you want to achieve and make them work on their lists of companies defined by you! If they will engage proper people in proper market verticals you should get very good results.
- Marketing Campaigns, there is no single universal solution for sales effective campaigns. However, there are a few tips you should follow. Firstly, you need to be able to precisely track each lead you are acquiring. You should match for each of them:
- source of traffic,
- at least last clicked advertisement (content),
- point of conversion – form on your website or on social media.
This data should be connected to lead/prospect in your sales team CRM where you will be able to track what they were able to achieve with each of them. You should not focus on the amount of leads and CPL. You should pursue after campaigns and its content which converts to Customers and gives you CACB (Customers Aquisition Cost Back) below 12 months keeping in mind that top-performing companies keep it under 6 months.
When you will cover the first step, then you should take care of your sales team structure. For start you should create main roles:
- Qualification – their job is too to make sure that leads passed to sales representatives have proper details like email, phone number, company name and are in target verticals of your company
- Sales representative – this role has at least a few different names. However, their purpose is similar. They are contacting new leads as the first “live” person from your company. During this mission, they will settle if those leads in fact are potentially interested in buying and are a good fit for your product. Very often the main KPI is to fix an online meeting with prospects and your business developers.
- Business development – your best and most experienced sales force. They are working on leads delivered by sales representatives and acquired solely by themselves, perform product demos and focus on building opportunities, forecasting, and closing deals.
How to determine with whom your best salespeople should work? Good start to find your own way is a quite old school BANT methodology:
- Budget: value generated by the solution will be higher than costs and potential Customer has allocated proper budget for implementation,
- Authority: budget criteria and interest were validated with a person who has a true decision-making role,
- Need: salesperson understands the goal or the problem potential buyer wants to achieve or solve, as well as what will happen if those will not be achieved,
- Timing: settled timeline in which potential buyer needs or wants to implement a new solution.
The most important thing here will be to determine the details for each of those 4 areas because they are slightly different for every company. In the beginning, you should make an exercise and check how those looked like for Customers already acquired. It will help to understand what your salespeople should look for. Remember to keep it as simple as possible and manageable for them.
Finally, the process should be structured and aligned with the sales funnel. Where you should determine proper stages and rules of moving prospects down the funnel. This will help you understand how much you need to spend on marketing to achieve a certain number of demos, opportunities or deals.
Focus of our salespeople on precisely chosen prospects from bigger companies for us resulted with the same and later higher sum of new MRR delivered each month but on lower numbers of logos. Which makes the onboarding process more efficient and meaningful. At the end we were able to increase average revenue per new account and the effectiveness of each business development managers:
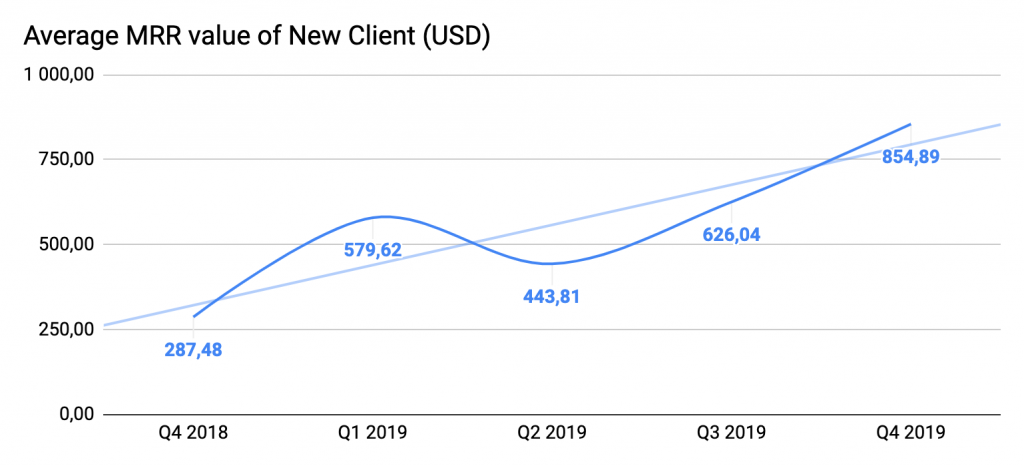
As you can see, the decision to go after bigger Customers was crucial here. Too small companies meant for us a big problem with high churn and difficulties in cash collection.
Improving overall customer satisfaction and loyalty
Continuous focusing and tailoring business according to the needs of a properly chosen target group impacts not only financial KPI’s but also average happiness of your clients base. You can see that on NPS (Net Promoter Score) factor:
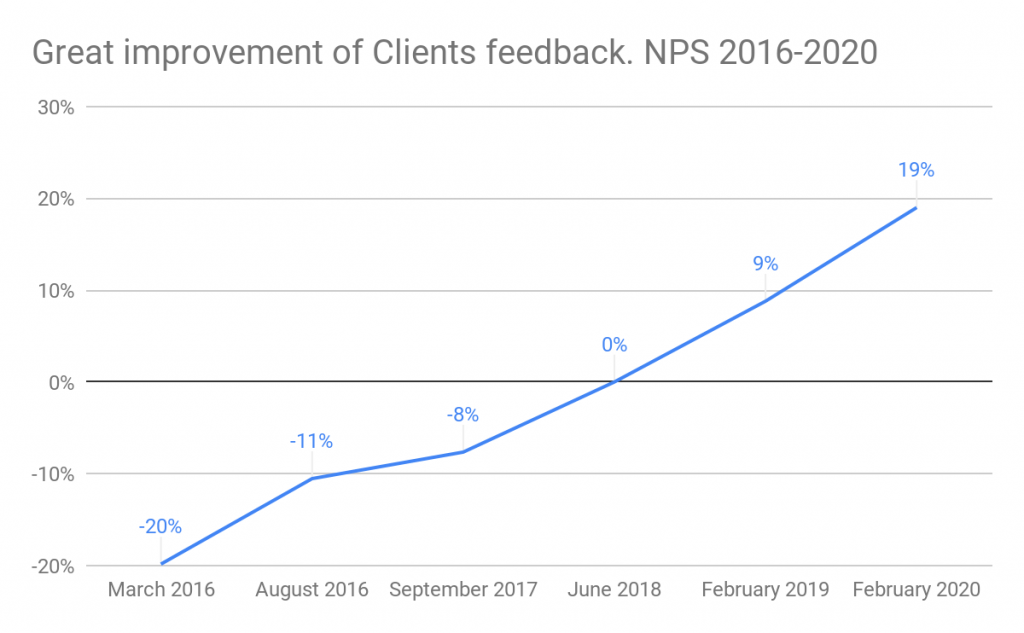
NPS gives you proper insight on your client base willingness to promote your product or solution amongst people they know. Working on their satisfaction powerups your brand recognition and enables one of the strongest marketing channels which is personal recommendation!
Final Remarks
Building +10M USD which will be able to quickly scale up to +100M USD ARR is a demanding job. In order to succeed you need to take a deep view into your data and enable a data-driven approach across the company.
Secondly business optimization is a constant process which requires brave decisions and taking risk by managing staff and CXO’s but to make them predictable and as good as possible, those decisions and managers must be backed up by skilled controlling teams. Remember, most of your problems and business cases were already experienced by some other people out there! Don’t be shy and look for advisors who will be able to give you knowledge and advantage of learning from their failures instead of yours!
Key takeaways:
- ARR & Growth are not only and for sure not best metrics to compare companies. Look also at: Rule of 40%, EBITDA (profitability), Hype Factor (capital effectiveness) & NPS
- SALESmanago Marketing Automation ended 2019 with 11.5M EUR ARR, 40% growth rate and 99,3% revenue retention rate
- Keeping high growth is strictly connected with data-driven approach, deep understanding of revenue structure, customer base and marketing & sales processes
- Dig deep in your Customers’ data to find your best segment – high dynamic, good retention and product/solution “stickiness”
- Understand why they chose your company and why they are staying. Then tailor marketing, sales, customer success and R&D processes.
Source:
EXPANSION SAAS BENCHMARKING STUDY
Kellblog – Introducing a New SaaS Metric: The Hype Factor
Written by:
Marek Broda SALESmanago COO
Greg Blazewicz SALESmanago CEO
 Follow