Customer Engagement is a direct consequence of Customer Experience. It is therefore the best measure for the effects of your hard work as well as a blueprint for improvement in product / service and all the services associated with it. In this article, we will present you with 10 most useful customer engagement metrics to follow. We also explain how Customer Data Platform can make this process a breeze.
Why is it important to measure Customer Engagement?
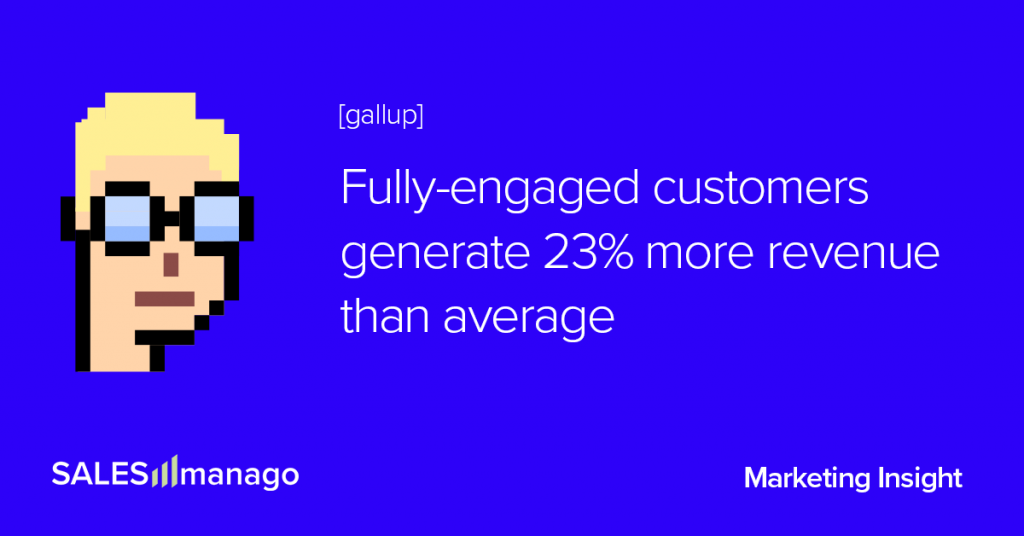
Depending on the industry, excellent customer service may be a part of competitive advantage or simply a must, because the intense competition turns the market into a red ocean. Not to mention that, according to Gallup, fully-engaged customer represents 23% more revenue than average.
In both these situations it is necessary to keep the customer retention high, if the company is to show year-to-year growth. The only way to keep high retention is to keep the customers engaged in your brand. If they are, they will be willing to communicate more and buy more from you. If not, they don’t care and they will leave you for a competitor at the first sign of a problem.
If we assume, to simplify the argument, that retention = engagement, then we have a pool of more or less meaningful facts that indicate the engagement and can serve as a metric for it.
In other words, measuring the engagement tells you exactly, how your prospect for further growth looks like at the moment. And will point to the areas worth improvement.
3 rules to follow in Customer Engagement measurement
Define the goals clearly
Simply put – you have to know your destination to accurately choose the way. Your first step to meaningful measurement of engagement metrics should be defining engagement goals.
This includes knowing the initial benchmarks and overall objective for the customer engagement strategy.
Keep quality is as important as quantity
Let us look at an example of quantitative data: when you only look at the numbers for your interactions with customers, you know how long people are waiting on hold and how long their phone calls are.
Now let’s look at qualitative data: you look at the notes in CRM and see what issues the customers are calling to report. Or what they like about your offer.
Quantity cannot fully replace quality. It is only a part of the picture. In this example, focusing on quantitative data only would not even tell you whether the conversations were going positively to your company.
Remember to include qualitative measurements in your customer engagement strategy. Qualitative measurements can be collected through customer feedback, case studies, and focus groups. Post-sales team that manages accounts should take note of their qualitative account health perspective.
Measure consistently
Key metrics, when left unchecked for a while, may cause trouble on the way to the set customer engagement goal. No reasonable picture can be drawn from data collected in a chaotic manner. Knowledge will let you react swiftly, when the problem emerges, for example, at customer service. Because you already knew about the problem from the feedback surveys and emails, and you found a way to address it.
10 Customer Engagement metrics to follow in eCommerce
Net Promoter Score (NPS)
Hi Jane! We’d love to hear how likely you are to recommend us to your friends!
… and the bar, showing clickable numbers from 0 to 10. This is how a typical Net Promoter Score survey looks like. Net Promoter Score shows you how likely a customer is to recommend your product to their friends and family. This is absolutely the top metric for those focused on growth, as it gives you a good idea of how satisfied your customers are with you.
NPS score provides a chance to make immediate judgement about what is going wrong because you can send the survey exactly after a transaction and also gauge the overall feeling of a customer towards your brand.
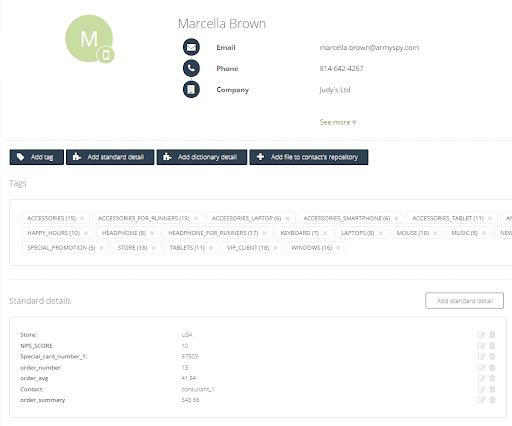
Net promoter score as a contact detail SALESmanago
The metric can be collected via in-app customer feedback forms or surveys. If the score is less than 9 or 10, follow-up questions should be given to close the feedback loop.
Customer Satisfaction (CSAT)
CSAT survey asks the customers how satisfied they are with the latest interaction they had with the company: recent purchase, interaction with customer service, live-chat conversation, etc.
A survey contains the rating scale. The questions should be as simple as possible, follow-up questions also can play their role, to gather more information about the interaction, especially, if the customer is somehow dissatisfied.
CSAT may prove very useful when the product is recently modified – a feature is added for example. It provides the company with immediate feedback, almost right after the purchase in some cases.
Satisfaction with customer service probed with this method may bring answers about the quality of scripts or training.
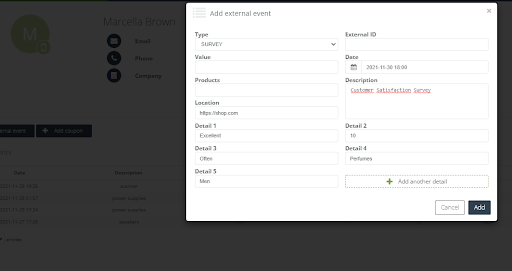
CSAT survey created as an event in SALESmanago
Customer Effort Score (CES)
An interesting metric, showing how much effort your customers have to put into fixing an issue or resolving their problem. Of course, the fact that they had to put an effort at all points to the problem. The more effort they have to exert, the worse the customer experience. Bad experience results in decreased and finally disappearing engagement.
To assess CES, it is useful to survey the customers in an omnichannel manner after an interaction with the brand. Like in the case of CSAT, the question about the overall difficulty of the issue-resolving process can be accompanied by the clickable, scaled bar.
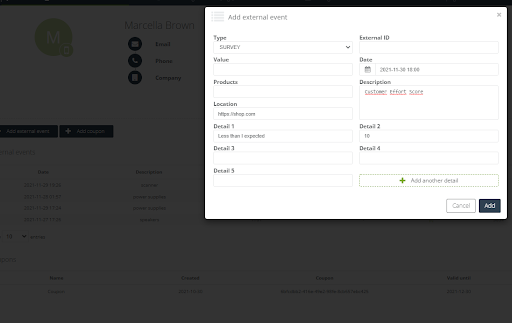
CES survey created as an event in SALESmanago
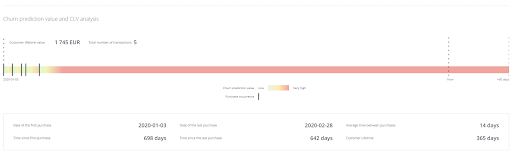
Customer Lifetime Value (CLV)
CLV shows a customer’s overall contribution to the company during customer lifetime. So to understand it, we have to define “lifetime”.
There is no one definition of customer lifetime. It can be safely assumed that this is a period from the customer’s acquisition to the last transaction. All the time in between, the customer is bringing the money to the company, so naturally, you want to prolong this “lifetime”, because the longer the customers are with you, the greater the chance for a major, expensive purchase is. Additionally, a long-lasting customer is likely engaged and satisfied enough to promote you among friends and family, maybe business partners.
Lifetime value (LV) = Average sale value X Number of transactions X Retention time
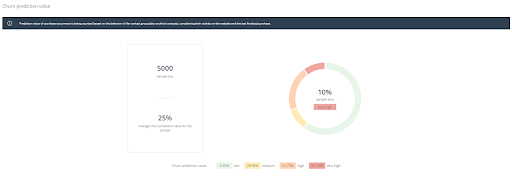
CLV is probably the most grounded metric for customer engagement. Probably this is why it is so popular and recognized. Increasing CLV shows great engagement, tied as closely as possible with the company’s success.
CLV = LV X Profit margin
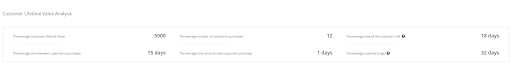
CLV from prediction dashboard
individual CLV in SALESmanago
In this day and age, when the overall customer acquisition cost often skyrockets, customer retention becomes even more important. It means a sustained source of profit at the cost 5-7 times less than new customer acquisition.
As many factors come into play in case of low CLV, not only overall value should be considered in order to fix the problem. Maybe the product/service is inaccessible? First week engagement metric or CES should be some indication etc.
Customer Engagement Score
CES is perfect to measure the customer engagement for SaaS-based businesses. Getting insights outside of the internet may prove to be difficult.
CES is used to measure the engagement of the customer base. It enables segmentation of the audience, understanding the areas where priority can be given, and measuring the impact of these strategies. Helps in the evaluation of engagement of customers as well as trial period customers. It will let you see who will be willing to convert from a trial period to a paid customer, identify the ones who will be ready to buy more products from you and the ones who are close to leaving you for a competitor.
To calculate CES, you should assess the kind of value that your product brings to the customers. Often used, simple example is that of a social media agency. The value such agency brings to its customers is the number of likes to each of its client’s posts.
You should write down each value your product brings and assign a weight to each of these values. The weight of the different values will, of course, vary. Times, when the value will occur to the customers, will vary also. So you have:
W – weight of a random value/benefit
N – Number of occurence of a random value/benefit
This way, you should end up with formula:
CES=W1N1+W2N2+W3N3 …
Customer Churn and Retention – Stickiness metrics
Customer Churn and Customer Retention measures the stickiness factor of your customers.
- Churn rate is the rate at which a business loses its customers.
- Customer Retention is the ability for a customer to retain its customers over time
Churn rate from prediction in SALESmanago
Of course, low churn rate and high retention rate is a goal you want to achieve for your business. As mentioned, new customers cost significantly more to acquire. Existing customers are more likely to buy your products at a premium and are more open to upselling and cross-selling.
Daily Active Users (DAU), Monthly Active Users (MAU) – user activity metrics
Two main parts of the user activity metrics are:
- Daily Active Users (DAU). This is the number of the unique users of a product or service per day.
- Monthly Active Users (MAU). This is the number of the unique users visiting a site within a month.
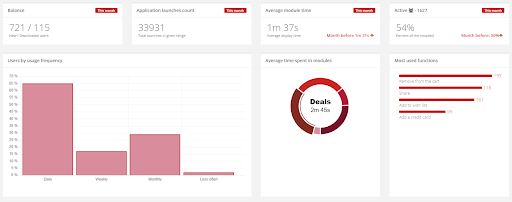
Dashboard from mobile module in SALESmanago
Both DAU and MAU reveal trends about how customers engage with your service/product. These trends can be used to develop your marketing strategies and improve retention efforts.
Session Time
Paying attention to the session time is one of the easiest methods to check if your product, service or content is actually engaging for the customers. This metric concerns both your website and your mobile application.
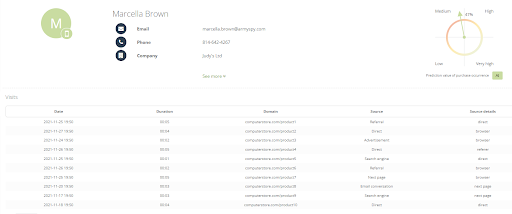
Sessions in SALESmanago. Frequency is also visible
With a lot of users logging into your website or app, you will clearly see which parts are more likely to maintain users’ attention for longer, and which are abandoned after just a few seconds. You will be able to judge if the popular parts of the site or app are actually those that bring you the most profit. If not, there is clearly a room for improvement, and the more popular parts of the site/app can provide a blueprint for it.
Visit Frequency
Some services might be used daily, weekly, monthly or even seasonally. This is why it is important to determine the ideal visit frequency number for a given service or product.
Once you’ve determined your ideal visit frequency rate, you can track this metric and use it to find trends in your customer’s activity.
Core User Actions
Core user action measures the amount of core actions users engage with when they visit your site. A customers may start by visiting your site after engaging with one of your email marketing campaigns. They may sign up for a free demo, purchase your product, and in time, they may try free demos for other products or read articles on your website’s blog—these are all desirable core user actions.
Your core user actions will depend on the service or product you offer, but the rate at which users engage with these core actions will always be a metric you can measure.
Improve your customer engagement smarter. How CDP can help?
It is absolutely possible to collect data for these metrics without the use of CDP. In such case:
- all this data has to gathered using different tools, that integrate data in different ways
- the data must be analyzed more or less manually, or using different tools,
- resulting information must be then send individually to different systems across your MarTech stack,
- analyzed data and the results must be somehow connected to the individual customers and their profiles.
- according actions must be taken by the operators of many different systems.
This is overall a daunting task and data loss, due to the connectivity problems across systems is usually tremendous. Not to mention the problem with data hygiene and resulting identity resolution difficulties, when it comes to enriching dispersed customer profiles in different systems.
Next-Gen Customer Data Platform, empowered by AI and machine learning, drastically improves the whole process. Modern CDP:
- automatically gathers all data needed for to monitor crucial engagement metrics,
- AI analyzes data and provides the company with resulting score in no-time,
- instead of dispersing data further across the systems, CDP gathers it all in one place,
- and this place is a unified customer profile, one single source of truth, accessible to all divisions of the company, so identity resolution to enrich the profiles with the score is solved seamlessly,
- all the operators take the according actions based on unified dataset in just one system.
In addition, Customer Data Platform provides the company with unified, coherent information about key engagement metrics in most cases both globally and as individual user scores. This way, it can prove to be useful not only for the marketers, as many executives are used to thinking, but for all company’s divisions which have anything to do with customer engament – including UX designers! To check how it would work for You, simply request a SALESmanago demo
 Follow